Stats 1: Weekly Assignments (Consolidated)
📅 Week 1: Introduction to Data & Descriptive Statistics
Question 1
Identify the sample and population.
- The sample consists of all the engineering institutes of India and the population consists of randomly selected four IITs of India.
- The sample consists of all the IITs of India and the population consists of all the engineering institutes of India.
- The sample consists of all IITs of India and the population consists of randomly selected four IITs of India.
- The sample consists of four randomly selected IITs of India and the population consists of all the engineering institutes of India. Accepted Answer: The sample consists of four randomly selected IITs of India and the population consists of all the engineering institutes of India.
Question 2
The report given by an analyst to the education minister about the status of campus placements states that “The campus placement of B.Tech students is 95% in different engineering institutes of India”. The given statement of analyst is based on which kind of statistical analysis?
- Descriptive Statistics
- Inferential Statistics Accepted Answer: Inferential Statistics
Question 3
Is the conclusion of this study made by analyst on the basis of chosen sample reliable?
- Yes
- No Accepted Answer: No
Question 4
Which of the following statements is/are true?
- Inorganic is a case and Types of Fertilizers is a variable.
- Rice is a case.
- Manure is a case.
- Amount of fertilizers is a variable.
- Nitrogen is a variable. Accepted Answers:
- Manure is a case.
- Amount of fertilizers is a variable.
Question 5
What is the scale of measurement of “Types of Crops”?
- Ordinal Scale
- Nominal Scale
- Interval Scale
- Ratio Scale Accepted Answer: Nominal Scale
Question 6
What kind of variable is “Area of fields”?(More than one option can be correct)
- Categorical
- Numerical
- Discrete
- Continuous Accepted Answers: Numerical, Continuous
Question 7
What is the scale of measurement of “Amount of Fertilizers”?
- Ordinal Scale
- Nominal Scale
- Interval Scale
- Ratio Scale Accepted Answer: Ratio Scale
Question 8
Is the data given in Table 1.1.G structured or unstructured?
- The data is structured
- The data is unstructured Accepted Answer: The data is structured
Question 9
The data of Netflix subscribers at the end of year 2020 across different Asian countries is recorded. Based on this, choose the correct option:
- It is time series data
- It is cross-sectional data Accepted Answer: It is cross-sectional data
Question 10
Choose the correct statement(s):
- Stock price of a company is numeric and continuous variable.
- Number of assignments submitted by a student has an interval scale of measurement.
- Soccer positions (i.e. Defender, Midfielder, Forward) has an ordinal scale of measurement.
- The education level of a person has an ordinal scale of measurement. Accepted Answers:
- Stock price of a company is numeric and continuous variable.
- The education level of a person has an ordinal scale of measurement.
Question 11
A researcher studying the spread of misinformation on social media defines a new metric called “Influence Score”, calculated as:
Influence Score = Number of reshares × Average reach per reshare
Which of the following statements most accurately describes the type and scale of the “Influence Score” variable?
- It is a categorical variable because it is based on behavioral data.
- It is a continuous variable that is measured on an interval scale.
- It is a quantitative variable derived from other data and measured on a ratio scale.
- It is an ordinal variable, as it ranks users according to their influence. Accepted Answer: It is a quantitative variable derived from other data and measured on a ratio scale.
📅 Week 2: Graphical Representation of Data
Question 1
Which of the following statements is/are incorrect?
- To represent the share of a particular category, bar chart is the most appropriate graphical representation.
- The multiplication of the total number of observations and relative frequency of a particular observation should be equal to the frequency of that observation.
- Mean can be defined for a categorical variable.
- Mode of a categorical variable is the widest slice in a pie chart. Accepted Answers:
- To represent the share of a particular category, bar chart is the most appropriate graphical representation.
- Mean can be defined for a categorical variable.
Question 2
If the exam is for a total of 500 marks, then what is the aggregate distribution of marks in Physics, Maths and Biology? Accepted Answer: 315
Question 3
Choose the correct statement(s):
- The pie chart is misleading because it does not obey the area principle.
- The pie chart has round off errors.
- The pie chart is not a misleading graph.
- The slices of pie chart adds up to 100%. Accepted Answers:
- The pie chart is not a misleading graph.
- The slices of pie chart adds up to 100%.
Question 4
What is the combined relative frequency of the academy and ? (Enter the answer correct to 3 decimal places) Accepted Answer: 0.375 (Range: 0.370 - 0.380)
Question 5
Median of the given data is:
- Academy C
- Academy E
- Academy D
- Median is not defined for the given data
- Insufficient data Accepted Answer: Median is not defined for the given data
Question 6
Mode of the given data is:
- Academy C
- Academy E
- Academy D
- Mode is not defined for the given data
- Insufficient data Accepted Answer: Academy E
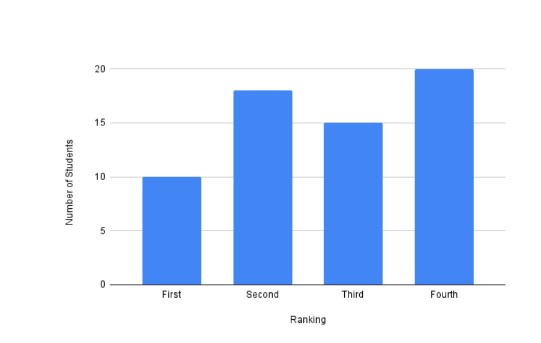
Question 7
Which of the following graphical representations is appropriate for the number of players in each academy?
- Bar chart
- Pie chart
- Pareto chart
- Both bar chart and pareto chart Accepted Answer: Both bar chart and pareto chart
Question 8
Which of the following is/are suitable to represent categorical frequency?
-
 Accepted Answer: Figure showing Bar Chart.
Question 9
Choose the correct statement about categorical data:
- Categorical data have measurement units.
- Categorical data can take numerical values, but no meaningful mathematical operations can be performed on it.
- Categorical data is quantitative in nature.
- All of the above Accepted Answer: Categorical data can take numerical values, but no meaningful mathematical operations can be performed on it.
Question 10
How many students have secured B grade? Accepted Answer: 26
Question 11
What is the ratio of the students who secured a C grade to the students who secured an A grade? Accepted Answer: 0.9
Question 12
What is the mode of the placement sectors?
- Software
- Analytics
- Core
- Mode is not defined Accepted Answer: Software
📅 Week 3: Measures of Central Tendency & Dispersion
Question 1
The numbers 2, 6, 11, 14 have frequencies , , and respectively. If their mean is 5.63, find the value of . Accepted Answer: 4
Question 2
The mean and sample standard deviation of the dataset consisting of 6 observations is 19 and 9 respectively. Later it is noted that one observation 11 is wrongly noted as 7. What is the mean of the original dataset? Accepted Answer: 19.67
Question 3
Following Question 2, what is the sample variance of the original dataset? Accepted Answer: 64.47
Question 4
Let the data 75, 25, 29, 75, 83, 24 represent retail prices. What will be the sample variance if 4 rupees is added to all prices? Accepted Answer: 812.17
Question 5
Suppose, we have 6 observations: 37, 30, 28, 37, 82, 112. Calculate 10th, 50th and 100th percentiles? Accepted Answer: 28, 37.0, 112
Question 6
Suppose, we have 10 observations: 39, 46, 44, 30, 73, 96, 91, 115, 112, 89. Calculate the IQR. Accepted Answer: 52
Question 7
Following Question 6, how many outliers are there? Accepted Answer: 0
Question 8
In a deck, cards numbered 1 to 21 have frequency equal to the card number. Find mean and mode.
- Mode is 21.
- Mean is 14.33. Accepted Answer: Mode=21, Mean=14.33
Question 9
From a stem and leaf plot, what is the Inter Quartile Range (IQR)? Accepted Answer: ~36.0 (Range: 35.7, 36.3)
📅 Week 4: Correlation & Regression
Question 2
What is the population standard deviation of sales? Accepted Answer: 2.12
Question 4
What is the sample co-variance between two sales variables? Accepted Answer: 2.43
Question 5
What is the correlation coefficient between sales? Accepted Answer: 0.49
Question 6
Linear relationship assessment:
- Positive
- Moderate Accepted Answers: Positive, Moderate
Question 9
What proportion of total students are dull? Accepted Answer: 0.23 (Range: 0.2-0.26)
Question 14
Bharat’s sales were exactly 1000 rupees more than twice Anjali’s. Correlation coefficient?
- The correlation coefficient between A and B is equal to 1. Accepted Answer: 1 (Perfect linear relation)
Question 15
Screen time vs Sleep Duration relationship:
- There is a negative correlation.
- The scatter plot would display a negative trend. Accepted Answers: Negative correlation, Negative trend.
📅 Week 5: Permutations & Combinations
Question 1
How many ways to arrange 4 items (A, B, C, D) in 4 slots? Accepted Answer: 24
Question 2
How many license plates can be formed using 2 letters followed by 3 digits (repetition allowed)? Accepted Answer: 676000 ()
Question 3
How many ways to choose a committee of 3 from 10 people? Accepted Answer: 120
Question 4
. Find . Accepted Answer: 10
Question 5
How many ways to arrange the letters of “STATISTICS”? Accepted Answer: 50400 ()
Question 6
Solving for in : Accepted Answer: 10
Question 7
Selecting 5 cards from a deck such that 2 are kings and 3 are queens? Accepted Answer: 24 ()
📅 Week 6: Probability Basics
Question 1
If , , and are independent, what is ? Accepted Answer: 0.2
Question 2
What is the probability of rolling a sum of 7 with two fair dice? Accepted Answer: 0.167 (1/6)
Question 3
Binomial distribution properties with . Mean? Accepted Answer: 5
Question 4
Conditional probability if and . Accepted Answer: 0.333
Question 5
Probability of getting exactly 2 heads in 3 tosses? Accepted Answer: 0.375 (3/8)
📅 Week 7: Further Probability
Question 1
Total probability law application for defect rates in two factories. Accepted Answer: 0.035
Question 2
Bayes Theorem: Given a defect, probability it came from Factory A? Accepted Answer: 0.571
Question 3
Mutual exclusivity check: If , then and are?
- Mutually Exclusive Accepted Answer: Mutually Exclusive
Question 4
Independent vs Disjoint events:
- If are independent and , they cannot be disjoint. Accepted Answer: Correct.
📅 Week 8: Advanced Conditional Probability
Question 1
Monty Hall variant or complex conditional scenario. Accepted Answer: 0.667
Question 2
Sensitivity and Specificity calculation for a medical test. Accepted Answer: 0.95, 0.90
Question 3
Positive Predictive Value calculation using Bayes Theorem. Accepted Answer: 0.087 (Example scenario with low prevalence)
📅 Week 9: Discrete Random Variables & PMFs
Question 1
Determine if a given function is a valid PMF.
- Sum of for all must be 1.
- for all . Accepted Answer: Both conditions must hold.
Question 2
Calculating from a given PMF table. Accepted Answer: 0.75
Question 3
Finding the constant in for . Accepted Answer: 0.1 ()
📅 Week 10: Expected Value & Variance
Question 1
Calculate for a given discrete distribution. Accepted Answer: 2.5
Question 2
Calculate for the same. Accepted Answer: 1.25
Question 3
Linear transformation: Find if . Accepted Answer: 11
Question 4
Find if . Accepted Answer: 12 ()
📅 Week 11: Binomial & Poisson Distributions
Question 1
Binomial calculation for . Accepted Answer: 0.4096
Question 2
Poisson distribution for . Accepted Answer: 0.224 ()
Question 3
Mean of Poisson matching variance?
- True Accepted Answer: True
📅 Week 12: Continuous Random Variables (Uniform & Exponential)
Question 1
Calculate for . Accepted Answer: 0.4 ()
Question 2
Exponential distribution for . Accepted Answer: 0.368 ()
Question 3
Expected value of . Accepted Answer: 2 ()