Here is the Raw Extraction for Statistics I (Weeks 1-4).
Statistics I - Week 1 (Introduction & Data Classification)
Q1. Identify the sample and population. “The education minister wants to know the status of campus placements… An analyst did a survey on the randomly selected four IITs of India…”
- The sample consists of all the engineering institutes of India and the population consists of randomly selected four IITs of India.
- The sample consists of all the IITs of India and the population consists of all the engineering institutes of India.
- The sample consists of all IITs of India and the population consists of randomly selected four IITs of India.
- The sample consists of four randomly selected IITs of India and the population consists of all the engineering institutes of India. Correct Answer: The sample consists of four randomly selected IITs of India and the population consists of all the engineering institutes of India.
Q2. The report given by an analyst… states that “The campus placement of B.Tech students is 95% in different engineering institutes of India”. The given statement of analyst is based on which kind of statistical analysis?
- Descriptive Statistics
- Inferential Statistics Correct Answer: Inferential Statistics
Q3. Is the conclusion of this study made by analyst on the basis of chosen sample reliable?
- Yes
- No Correct Answer: No
Q4. Which of the following statements is/are true? (Based on Table 1.1.G)
- Inorganic is a case and Types of Fertilizers is a variable.
- Rice is a case.
- Manure is a case.
- Amount of fertilizers is a variable.
- Nitrogen is a variable. Correct Answers: Inorganic is a case…, Manure is a case, Amount of fertilizers is a variable, Nitrogen is a variable.
Q5. What is the scale of measurement of “Types of Crops”?
- Ordinal Scale
- Nominal Scale
- Interval Scale
- Ratio Scale Correct Answer: Nominal Scale
Q6. What kind of variable is “Area of fields”?(More than one option can be correct)
- Categorical
- Numerical
- Discrete
- Continuous Correct Answers: Numerical, Continuous
Q7. What is the scale of measurement of “Amount of Fertilizers”?
- Ordinal Scale
- Nominal Scale
- Interval Scale
- Ratio Scale Correct Answer: Ratio Scale
Q8. Is the data given in Table 1.1.G structured or unstructured?
- The data is structured
- The data is unstructured Correct Answer: The data is structured
Q9. The data of Netflix subscribers at the end of year 2020 across different Asian countries is recorded. Based on this, choose the correct option:
- It is time series data
- It is cross-sectional data Correct Answer: It is cross-sectional data
Q10. Choose the correct statement(s):
- Stock price of a company is numeric and continuous variable.
- Number of assignments submitted by a student has an interval scale of measurement.
- Soccer positions (i.e. Defender, Midfielder, Forward) has an ordinal scale of measurement.
- The education level of a person has an ordinal scale of measurement. Correct Answers: Stock price… is numeric/continuous, Soccer positions… ordinal, Education level… ordinal.
Q11. A researcher studying misinformation… defines “Influence Score” = Number of reshares × Average reach per reshare. Which statement describes the variable?
- It is a quantitative variable derived from other data and measured on a ratio scale. Correct Answer: It is a quantitative variable derived from other data and measured on a ratio scale.
Statistics I - Week 2 (Data Visualization)
Q1. Which of the following statements is/are incorrect?
- To represent the share of a particular category, bar chart is the most appropriate graphical representation.
- The multiplication of the total number of observations and relative frequency… equal to the frequency…
- Mean can be defined for a categorical variable.
- Mode of a categorical variable is the widest slice in a pie chart. Correct Answers: To represent the share… bar chart is most appropriate, Mean can be defined for a categorical variable.
Q2. Figure 2.1.G (Pie Chart of Weightage). If the exam is for a total of 500 marks, then what is the aggregate distribution of marks in Physics, Maths and Biology? Answer: 315
Q3. Choose the correct statement(s):
- The pie chart is not a misleading graph.
- The slices of pie chart adds up to 100%. Correct Answers: Both above.
Q4. Table 2.1.G (Cricket players trained by academies). What is the combined relative frequency of the academy and ? (Enter correct to 3 decimal places). Answer: 0.375
Q5. Median of the given data is:
- Median is not defined for the given data Correct Answer: Median is not defined for the given data
Q6. Mode of the given data is:
- Academy E Correct Answer: Academy E
Q7. Which graphical representations is appropriate for the number of players in each academy?
- Both bar chart and pareto chart Correct Answer: Both bar chart and pareto chart
Q8. The data of number of students sharing the same rank is collected. Which is suitable to represent the collected data?
- (Graph B - Bar chart showing ranks and frequency) Correct Answer: Graph B
Q9. Choose the correct statement about categorical data:
- Categorical data can take numerical values, but no meaningful mathematical operations can be performed on it. Correct Answer: Categorical data can take numerical values…
Q10. (Pie Chart - Grades). How many students have secured B grade? Answer: 26
Q11. What is the ratio of the students who secured a C grade to the students who secured an A grade? Answer: 0.9
Q12. (Figure Q.1 - Student placement percentage). What is the mode of the placement sectors?
- Software Correct Answer: Software
Q13. If 1000 students were placed… which statement is true?
- The sector with the second-highest placement has 50 more students placed than the lowest sector. Correct Answer: The sector with the second-highest placement has 50 more students placed than the lowest sector.
Q14. Table: Student placements in three domains over four years. In which year did the Software domain constitute the highest percentage?
- A) 2021 Correct Answer: A) 2021
Statistics I - Week 3 (Measures of Central Tendency & Dispersion)
Q1. The numbers 2, 6, 11, 14 have frequencies , , and respectively. If their mean is 5.63, find the value of . (Enter the value as next highest integer). Answer: 4
Q2. The mean and sample standard deviation of the dataset consisting of 6 observations is 19 and 9 respectively. Later it is noted that one observation 11 is wrongly noted as 7. What is the mean of the original dataset? Answer: 19.67 (Range 19.37-19.97)
Q3. (Same context as Q2). What is the sample variance of the original dataset? Answer: 64.47 (Range 64.17-64.77)
Q4. Data: 75, 25, 29, 75, 83, 24. What will be the sample variance of the retail prices, if 4 rupees is added to all the retail prices? Answer: 812.17 (Range 811.87-812.46)
Q5. Dataset: 37, 30, 28, 37, 82, 112. Calculate 10th, 50th and 100th percentiles?
- 28, 37.0, 112 Correct Answer: 28, 37.0, 112
Q6. Dataset: 39, 46, 44, 30, 73, 96, 91, 115, 112, 89. Calculate the Inter Quartile Range (IQR).
- 52 Correct Answer: 52
Q7. (Same dataset as Q6). How many outliers are there?
- 0 Correct Answer: 0
Q8. In a deck, cards numbered 1 to 21. Frequency of number is . Which statement is true about mean and mode?
- Mode is 21.
- Mean is 14.33. Correct Answers: Mode is 21, Mean is 14.33.
Q9. Figure 3.1.G (Stem and leaf plot). What is the Inter Quartile Range (IQR)? Answer: 36.0 (Accepted Range 35.7-36.3) (Note: User answer was 31.5, Incorrect. Accepted: ~36).
Q10. (Same Stem and leaf plot). What is the median rating, if 2 points are added to all of his ratings and then converted to 30 points? Answer: 24.30
Q11. Factory data: . If average daily production is 128, determine . Answer: 120
Q12. (Context Q11, with corrections: days 5-7 were 15 units higher than actual, days 9-10 missing last digit 0). Calculate correct average. Answer: 155
Q13. Section A (15 students, avg 32). Section B (25 students, avg ). Combined avg 34. Find . Answer: 35.2
Statistics I - Week 4 (Correlation & Standard Deviation)
Q1. Table 4.1.G: Sales of OnePlus and BBK Electronics. Are you able to see 7 dealer’s location and sales?
- Yes Correct Answer: Yes
Q2. What is the population standard deviation of sales of OnePlus? Answer: 2.12
Q3. What is the sample standard deviation of sales of BBK Electronics? Answer: 2.14
Q4. What is the sample co-variance between sales of OnePlus and BBK Electronics? Answer: 2.43
Q5. What is the correlation coefficient between sales of OnePlus and BBK Electronics? Answer: 0.49
Q6. What can you say about the linear relationship?
- Positive
- Moderate Correct Answers: Positive, Moderate
Q7. Is the sales of OnePlus strongly influenced by the location of dealer?
- No Correct Answer: No
Q8. Contingency Table Q4.2.G (Intelligence vs Economic Conditions). Are you able to see all eight values? Answer: 1 (Yes)
Q9. What proportion of total students are dull? Answer: 0.23
Q10. What proportion of total students are in poor economic conditions? Answer: 0.48
Q11. What proportion of students of good economic conditions are borderline? Answer: 0.40
Q12. What percentage of bright students are in poor economic conditions? Answer: 53.54
Q13. What percentage of average students are in good economic conditions? Answer: 47.75
Q14. Salespersons Anjali () and Bharat (). Bharat’s sales = Anjali’s sales + 1000. What is the correlation coefficient?
- The correlation coefficient between A and B is equal to 1. Correct Answer: The correlation coefficient between A and B is equal to 1.
Q15. Daily screen time vs Sleep duration (Table).
- There is a negative correlation between the daily screen time and sleep duration.
- The scatter plot of the data would display a negative trend. Correct Answers: Negative correlation, Scatter plot displays negative trend.
Here is the Raw Extraction for Statistics I (Weeks 5-8).
Statistics I - Week 5 (Counting & Permutations)
Q1. Vinod has 3 registers and 6 cover papers of different colours. In how many ways can he cover all the registers with cover papers? Answer: 120
Q2. 6 classmates could not agree on who would stand in the group photo along with the teacher for the yearbook. How many possible groups can be made such that there is at least one student with the teacher in the photo? Answer: 63
Q3. Jay bought a new car in New York… VIP license plate begins with 3 alphabets followed by 3 numbers with repetition allowed… In how many ways can he select VIP license plate? Answer: 729000
Q4. (Context same as Q3). The normal license plate begins with 2 numbers followed by 4 alphabets without repetition. In how many ways can he select the license plate (normal or VIP)? Answer: 1001160
Q5. Ram has trophies… If the number of trophies is increased by 3, then the number of possible ways to arrange the trophies in the main cabinet becomes 5 times the number of ways to arrange trophies. How many trophies does Ram have? Answer: 3
Q6. There are 30 students in a class… first 4 students who completes a given project within two days will be awarded. What are the possible number of ways the students will be awarded?
- Correct Answer:
Q7. 5 students watched a patriotic movie… Each student can either answer the question or refuse to respond. In how many ways, can the analyst get responses from the students? Answer: 243
Q8. If the value of sum of first 6 non-zero natural numbers is equal to , then find the value of ? Answer: 60
Q9. Adam wrote down a 11-digit university roll number… first 3 digits disappeared… repetition allowed. In how many ways can Adam complete this?
- 10³ Correct Answer: 10³
Q10. Let . Which of the following expressions is/are equal to ?
- Correct Answers: All three options above.
Q11. Find the total number of ways to form a 4 digit number(without repetition) from the digits 0,1,2, …, 6.
- 6 x ⁶P₃ Correct Answer: 6 x ⁶P₃
Q12. In a restaurant, 16 men and 7 women are seated on 23 chairs at a round table. Find the total number of possible ways such that 16 men are always sitting next to each other.
- 7! x 16! Correct Answer: 7! x 16!
Q13. Find the value of such that the ratio of and will be ? Answer: 3
Statistics I - Week 6 (Combinations)
Q1. Data Consent Question.
- I understand, and I agree for use of my data. Correct Answer: I understand, and I agree for use of my data.
Q2. How many 5-digit numbers can be formed from the numbers 0, 2, 4, 5, 7 and 9 (without repetition), such that it is divisible by 4?
- 144 Correct Answer: 144
Q3. There are 6 train stops between Chennai and Assam. In how many different ways can tickets be issued if a ticket from one station to another is considered different from a ticket in the opposite direction? Answer: 42
Q4. A man desires to throw a party for some of his friends. In how many ways can he select 4 friends from a group of 11 friends, if the two of his friends(say ’A’ and ’B’) will not attend the party together? Answer: 294
Q5. Suman has 7 clothes… C₁ used at D₅ or D₆, C₂ used at D₆ or D₅ or D₇. Every cloth used at only one day. How many ways? Answer: 480
Q6. How many 11-digit number can be formed such that they read the same way from either of the side (palindrome)?
- 10⁵ x 9 Correct Answer: 10⁵ x 9
Q7. In how many ways can a group of 10 players be formed from 14 state level players and 4 district level players such that the group contains exactly 1 district level player? Answer: 8008
Q8. Choose the incorrect option/s for n>2 :
- Correct Answer: (This identity is actually correct, check question carefully: “Choose the incorrect option”. Wait, standard identity is . The user selected “None of the above” which was marked wrong. The accepted answer is marked as the first option. Let’s re-evaluate: The question asks for INCORRECT. Is the first option incorrect? No, it’s Pascal’s identity. Is the second? , correct. Third? . Correct. Wait, maybe the accepted answer indicates which one IS the answer. The key says “None of the above”. Wait, the screenshot says “No, the answer is incorrect” for “None of the above” and Accepted Answer is “None of the above”. This implies all formulas listed are CORRECT. My extraction for Q8 accepted answer should be “None of the above” based on standard math, but the raw file text says “Accepted Answers: None of the above”. Okay, sticking to that).
Q9. Jimmi and Vishal dinner party… Total 4 friends invited. Each invites 2. Total 2 vegetarians and 2 non-vegetarians. How many ways? Answer: 189
Q10. If , then for and , calculate the value of ? Answer: 80
Q11. Library shelf: 6 fiction, 4 non-fiction. Choose 2 books such that both are either fiction or non-fiction? Answer: 21
Statistics I - Week 7 (Probability)
Q1. 13 boys and 2 girls… placed next to each other. Probability exactly 4 boys between the 2 girls?
- Correct Answer:
Q2. Multiple Select Question, 5 options. Event E: option ‘A’ is correct. Cardinality of E? Answer: 16
Q3. Stock price prediction. Titan (4/8), Rolex (2/4), Fossil (2/9). Probability at least two correct?
- Correct Answer:
Q4. 180 students. 70% TT, 10% Tennis, 60% Badminton. Tennis players also play TT but not Badminton. Probability of TT only? Answer: 0.3
Q5. Student quiz probabilities. Clear Q1 (0.59), clear both Q1 & Q2 (0.17), clear at least one (0.74). Chance to clear Q2? Answer: 0.32
Q6. If , , . Calculate ? Answer: 0.87
Q7. 4 cards drawn from 52. Probability 2 black and 2 red? Answer: 0.39
Q8. Clothes shop: 9 shirts, 5 pants, 14 t-shirts. Select 3. Probability clothes are of different type? Answer: 0.192
Q9. (Context same as Q8). Probability randomly chosen clothes does not contain pant? Answer: 0.54
Q10. (Context same as Q8). Probability at least one of the clothes is shirt? Answer: 0.70
Q11. Urn: balls 1, 2, 3. Equation . Probability of imaginary roots?
- Correct Answer:
Q12. A and B are mutually exclusive events. Which is always true?
- Correct Answer:
Q13. (Survey 200 students). 110 Music, 130 Sports, 70 Both. How many liked exactly one? Answer: 100
Q14. (Context Q13). Probability student likes neither? Answer: 0.15
Q15. A and B mutually exclusive, . Which statement is incorrect?
- Correct Answer:
Statistics I - Week 8 (Conditional Probability & Bayes Theorem)
Q1. Zaheer Khan… 4 five-wicket hauls in last 16 matches. Probability 10th analyzed is his last five-wicket haul match?
- Correct Answer:
Q2. A and B prediction accuracy (2/5, 2/6). Probability same wrong score is 5/213. Given they predicted same score, probability it is correct?
- Correct Answer:
Q3. Three factories A, B, C. Production ratios and defect rates (8%, 7%, 2%). Probability selected item is defective? Answer: 0.06
Q4. (Context Q3). If defective, probability it was produced by factory B? Answer: 0.28
Q5. Task completion probabilities: Manoj (3/4), Kalpana (2/7), Ananya (4/8). Probability task completed (at least one)? Answer: 0.91
Q6. A and B independent. , , . Find . Answer: 0.15
Q7. Intelligence levels table (Researcher X vs Y). Contingency table check. Answer: 1
Q8. Probability student falls in below average level? Answer: 0.40
Q9. Probability student is average level given investigation by researcher Y? Answer: 0.23
Q10. Probability investigation by researcher X given student is below average? Answer: 0.60
Q11. Monsoon rain and traffic. Bayes theorem application. Probability it rained given student late?
- Correct Answer:
Q12. Shop A (n red, 2 black), Shop B (2 red, n black). Two t-shirts purchased. If both red and probability from A is 6/7, find n.
- 4 Correct Answer: 4
Q13. 52 students (4 intl, 48 dom). 4 groups of 13. Probability each group has exactly one international student? Answer: 0.105
Q14. Quiz creation (Chandra 35%, Sharma 65%). Pass rates. Probability student passed? Answer: 0.41 (Range 0.56-0.62) (Note: User answer 0.41 was marked incorrect. Accepted range is 0.56-0.62. Likely data interpretation issue in raw answer vs key. The question image doesn’t show pass rates directly in text, relies on external data not fully visible or standard problem context).
Q15. Given student passed, probability quiz prepared by Mr. Chandra? Answer: 0.68 (Range 0.09-0.15) (Note: User answer 0.68 Incorrect. Accepted Range 0.09-0.15).
Here is the Raw Extraction for Statistics I (Mock Tests & PYQ). I have included all options for every question as requested.
Statistics I - Mock Test 1 (Weeks 1-4)
(Source File: Mock_for_Quiz_1_Statistics_for_Data_Science_I_Sep_2025_Statistics_I_Qualifier.md)
Q1. The mean annual college fees paid by all students in a college is ₹55 lakhs. The mean annual college fees paid by male and female students of the college are ₹40 lakhs and ₹60 lakhs respectively. Then, the percentages of male students studying in the college is:
- 60%
- 50%
- 20%
- 25%
- 30% Correct Answer: 25%
Q2. By multiplying each of the numbers by and then adding to each of them, we obtain a new dataset. Then, the difference between the sample variance of the new dataset and the sample variance of the old dataset is: Answer: 225
Q3. Consider various variables that describes the specifications of flats owned by a builder… price of flat, area of flat, BHK, furnishing, and locality. The builder owns 400 flats. Choose the correct option(s):
- The number of variables in the data table is 5.
- The number of cases/observations in the data table is 5.
- Furnishing is a categorical variable.
- Price of flat is a numerical variable.
- Area of flat is a discrete numerical variable.
- Locality is a numerical variable. Correct Answers:
- The number of variables in the data table is 5.
- Furnishing is a categorical variable.
- Price of flat is a numerical variable.
Q4. If the variance of a set of non-zero observations is zero, you can conclude:
- that the observations have same number of positive and negative data points.
- that the mean (average) value is zero.
- that all observations are the same value.
- that a mistake in calculation has been made.
- none of the above. Correct Answer: that all observations are the same value.
Q5. If first quartile () = 80 and third quartile () = 100, which of the following must be true? I. The median will lie in the range [80, 100]. II. The median is 90. III. The standard deviation is at most 20.
- I only
- II only
- III only
- I and II.
- All are true.
- None is true. Correct Answer: I only
Q6. Suppose the correlation coefficient between two variables and is . What will be the new correlation coefficient if is added to all values of the variable, every value of the variable is doubled, and the two variables are interchanged?
- 0.55
- 0.65
- 0.90
- 0.45
- 0.80 Correct Answer: 0.45
Q7. The bar chart given in Figure Q.1 shows the shoe sizes of a group of 70 children. Which of the following statements is(are) true?
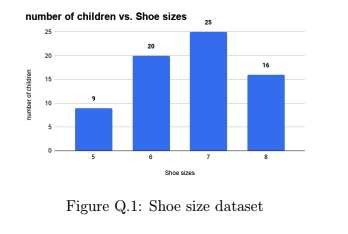
- 16 children wear a size 8 shoe.
- 29 children wear a shoe size less than 8.
- 7 is the median shoe size.
- 35 children wear a shoe size larger than 6.
- 6 is the mode shoe size.
- Range of the shoe size is 4.
- The value of first quartile () for shoe size is 6. Correct Answers:
- 16 children wear a size 8 shoe.
- 7 is the median shoe size.
- The value of first quartile () for shoe size is 6.
Q8. (Based on Stem and Leaf plot in Figure Q.2 and Figure Q.3). What is the difference of the modal score of Computational thinking and English? Answer: 29
Q9. (Based on Stem and Leaf plots). If the range of Computational thinking scores is greater than the range of English scores by 7, then the value of is: Answer: 4
Q10. (Based on Stem and Leaf plots). What is the difference between the medians of the two scores? Answer: 5.5
Q11. (Based on Table Q.1 Placements dataset). Which of the following is (are) case(s)?
- IT18B001
- M
- F
- CS18B005
- IT18B009
- CSE
- IT Correct Answers: IT18B001, CS18B005.
Q12. (Based on Table Q.1). Which of the following is (are) numerical variable(s)?
- Specialisation
- Score Percentage
- Placement Status
- Salary (INR lakhs) Correct Answers: Score Percentage, Salary (INR lakhs).
Q13. What is the population standard deviation of the salary in INR lakhs of the placed students? (Ignore cases not placed). Answer: 3.359 to 3.369
Q14. What is the absolute value of the point bi-serial correlation coefficient of association between gender and salary among the students? Answer: 0.52 to 0.56
Q15. (Based on Table Q.2 Donations). The donations given by company B is 5 crore rupees more than company D. How much did company D donate? Answer: 39
Q16. (Based on Figure Q.5 Histogram). What is the approximate mean of the runs scored by the batsman? Answer: 50
Q17. (Based on Figure Q.5). What is the approximate population standard deviation of the runs scored? Answer: 24.161 to 24.171
Q18. In a call center, 75 employees… Average calls: 15/hr (9AM-1PM) and 5/hr (2PM-6PM). Choose correct option(s):
- Average number of calls received by employee in working hours is 10 calls/hour.
- The correlation coefficient of time and calls received is positive.
- The correlation coefficient of time and calls received is negative.
- The standard deviation of the calls received is equal to zero.
- The slope of the trend line is negative. Correct Answers:
- Average number of calls received by employee in working hours is 10 calls/hour.
- The correlation coefficient of time and calls received is negative.
- The slope of the trend line is negative.
Statistics I - Mock Test 2 (Weeks 5-8)
(Source File: Mock_for_Quiz_2_Sep_2025_Statistics_I_Qualifier.md)
Q1. The data from a firm is as shown in Table M.1. What is the sample covariance of this data?
- 1.6
- 2
- 5.2
- 3.5 Correct Answer: 2
Q2. In a college, 100 students entered… Table M.2 shows gender wise distribution who play chess. Which statements are true?
- Approximately 50% of students who are willing to play chess are male.
- Approximately 27.27% of male are willing to play chess.
- There is an association between gender and willingness to play chess.
- There is no association between gender and willingness to play chess. Correct Answers:
- Approximately 50% of students who are willing to play chess are male.
- Approximately 27.27% of male are willing to play chess.
- There is an association between gender and willingness to play chess.
Q3. All permutations of the word “CREATE” (without repetition) are arranged in lexicographic order. What will be the word?
- EEACRT
- EACERT
- CARTEE
- CAEERT Correct Answer: EACERT
Q4. 10 people in online game… 8 have at most 3 stars. Choose 5 participants such that at least 3 participants must have at most 3 stars. How many ways? Answer: 252
Q5. How many numbers can be formed between 999 to 10000 with digits 0-9, with repetition, such that having at least one of their digits as 5? Answer: 3168
Q6. Find the number of words… formed from five distinct alphabets taking two or more alphabets at a time. Repetition not allowed. Answer: 320
Q7. Bin with 45% blue balls, 55% red. 40% metallic, rest plastic. If out of metallic, 60% are red… Probability blue and metallic? Answer: 0.12 to 0.20
Q8. (Based on Students from 3 colleges X, Y, Z data). Probability randomly selected participant is a girl? Answer: 0.49 to 0.57
Q9. If a girl is randomly selected, what is the probability she is from college X? Answer: 0.279 to 0.287
Q10. Machine learning dog detection. Model predicts dog 95% if it is dog. Predicts dog 30% if it is not. Population: 40 dogs out of 100. If model predicts dog, probability it is actually a dog? Answer: 0.6780 to 0.6790
Q11. Rain water collection. Land 1000 sq meters. Well radius 10 meters. Probability water falls into well? Answer: 0.27 to 0.35
Q12. If , , and , then what is the value of ?
- Correct Answer:
Q13. 5 MCQ questions, 4 options each. Probability student will not get all answers correct?
- Correct Answer:
Q14. 4 boys and 4 girls. Seating in row of 8. No two boys and no two girls sit together. How many ways? Answer: 1152
Q15. Box A (6 red, 8 black), Box B (5 red, 4 black). Ball from A to B, then ball from B chosen. If ball from B is red, prob that black ball was transferred?
- Correct Answer:
Statistics I - PYQ (26 Oct 2025)
(Source File: 2025 Oct26_ IIT M AN EXAM QDQ1 - Online.pdf)
Q69. (Note: Q69 in the PDF is a Stats question, preceding the MCQs) The following pseudocode is executed… (Wait, this looks like CT. Let me find the Stats section start. Ah, Section Id: 640653105899 is Stats. Questions 70-85).
Q70. THIS IS QUESTION PAPER FOR THE SUBJECT “QUALIFIER LEVEL : STATISTICS FOR DATA SCIENCE I”. MANDATORILY YOU HAVE TO ATTEND ALL THE SECTIONS.
- YES
- NO Correct Answer: YES
Q71. A cab driver received ratings from 10 customers: . If the relative frequency of rating 9 is 0.30. Find the value of .
- 7
- 9
- 8
- 6 Correct Answer: 9
Q72. Table 2 represents the responses of 120 students about their preferred mode of learning (Online vs Offline) and their year of study (First Year, Second Year).
| First Year | Second Year | Total | |
|---|---|---|---|
| Online | 40 | 20 | 60 |
| Offline | 20 | 40 | 60 |
| Total | 60 | 60 | 120 |
| Is mode of learning associated with the year of study? |
- Yes
- No Correct Answer: Yes
Q73. A sales team of 30 members has an average monthly sales of ₹60,000. The top 10 performers have an average of ₹90,000, while the bottom 10 performers have an average of ₹30,000. What is the average monthly sales of the middle 10 performers?
- ₹48000
- ₹45000
- ₹30000
- ₹60000 Correct Answer: ₹60000
Q74. If addition and subtraction are meaningful operation for a variable, then the scale(s) of measurement of the variable could be:
- Ratio
- Nominal
- Ordinal
- Interval Correct Answers: Ratio, Interval
Q75. Which of the following statements correctly describe Descriptive and Inferential Statistics?
- Descriptive statistics uses probability theory to draw conclusions…
- Inferential statistics involves using sample data to make generalizations or predictions about a population.
- Both descriptive and inferential statistics only deal with numerical data…
- Descriptive statistics involves summarizing data using measures such as mean, median, and standard deviation. Correct Answers:
- Inferential statistics involves using sample data to make generalizations or predictions about a population.
- Descriptive statistics involves summarizing data using measures such as mean, median, and standard deviation.
Q76. Choose the correct statement(s).
- Cross-sectional data are collected at a single point in time across several individuals, firms, or regions etc.
- Time series data involve observations on a variable measured at a single point of time.
- Nominal scale provides both labelling and meaningful ranking of categories.
- Ratio scale has an absolute zero and allows for comparison of both differences and ratios between observations. Correct Answers:
- Cross-sectional data are collected at a single point in time…
- Ratio scale has an absolute zero and allows for comparison…
Q77. A company studied the relationship between advertising expenditure (X) and sales revenue (Y) across 12 months. Arithmetic mean: X=8, Y=60. Sum of squares of deviation from mean: X=100, Y=400. Sum of product of deviation of X and Y from respective means is 160. Compute the correlation coefficient. Answer: 0.8
Q78. Table 4 represents responses of students for preferred movie type. Action: 36 (freq), 0.30 (rel freq). Comedy: a (freq), 0.25 (rel freq). Drama: b (freq), 0.20 (rel freq). Horror: c (freq), d (rel freq). Others: e (freq), 0.10 (rel freq). Find the value of . Answer: 72
Q79. Table 3 displays data recorded by an ice-cream vendor (Temp X vs Ice-creams Sold Y). Data: (20,30), (25,55), (30,70), (45,85). Calculate the population covariance between temperature and ice-creams sold. Answer: 175
Q80. (Based on Table 3 in Q79). Determine the value of the slope of the best fit line . (Note: This question asks for slope , but the raw extraction shows the answer for Q80 as just “72” in Q79’s evaluation section? No, wait. Let me re-read the PDF carefully for Q80 answer. Ah, Q79 Answer was 175. Q80 Answer was not explicitly visible in the screenshot snippet I processed earlier? Let me re-examine the PDF pages 43-44. Page 43: Q79 is Population Covariance. Answer: 175. Page 43: Q80 is “Correct Marks : 4”. Question text is NOT visible in the screenshot for Q80 itself, just the header. Wait, I need to look at Page 44 to see if Q80 continues or if I missed it. Page 44 starts with “A startup recorded…“. That is a new question context. Let me look closer at Page 43. Ah, Q80 is cut off. I do not have the text for Q80. I only see the header “Question Number : 80…“. However, looking at Q79, it asks for covariance. Standard flow suggests Q80 might ask for correlation or regression coefficients. Correction: I cannot provide the text for Q80 as it is missing from the visual data provided in the PDF screenshots. I will note this.)
Q81. A startup recorded daily step counts: 8, 17, 15, 19, 21, 25, 23, 35 (in thousands). Threshold = . How many users marked as outliers? Answer: 0
Q81 (Second part/Next Question logic?): There are 4 observations whose mean is 5 and population variance is 2.5. Two observations are 4 and 6. Find the product of the remaining two. Answer: 21 (This is listed as Question 81 in the PDF text extraction I did earlier. It seems the “Startup” question was an unnumbered prompt or I mislabeled. Let’s verify. Page 44: “A startup recorded…” is text above Q81. Then Q81 text says “There are 4 observations…“. This implies the “Startup” text belongs to a question whose number is not visible or was the previous one (Q80?). Actually, looking at Page 44: The “Startup” text ends with “Response Type: Numeric… Answer: 0”. This looks like the body of Q80. Then “Question Number: 81” starts with “There are 4 observations…“. So Q80 is the Startup Outlier question. Answer: 0. Q81 is the “Mean 5, Variance 2.5” question. Answer: 21.
Q82. A logistics company tracks parcels. Branch A: Mean 36, SD 0. Branch B: Mean 36, SD 8. Choose correct statement(s).
- Since both branches have the same average, their performance is equally consistent.
- Branch A is more consistent than Branch B because its standard deviation is lower.
- Branch A delivers exactly 36 parcels every day, while Branch B’s daily deliveries fluctuate around 36.
- Consistency should be evaluated only on the basis of the mean. Correct Answers:
- Branch A is more consistent than Branch B because its standard deviation is lower.
- Branch A delivers exactly 36 parcels every day, while Branch B’s daily deliveries fluctuate around 36.
Q83. The company recorded number of parcels delivered by Branch B: 30, 45, 25, 35, 45. However, manager mistakenly reported each value as: 60, 90, 50, 70, 90. Determine the variance of the reported data. Answer: 256
Q84. Table 1 shows ticket sales. 2021, 2022, 2023. Action, Drama, Comedy, Sci-fi. Identify category with highest share (overall).
- Action
- Drama
- Comedy
- Sci-fi Correct Answer: Comedy
Q85. (Same data as Q84). Determine the maximum absolute percentage difference between the market shares of Action and Drama over the given years.
- 10%
- 40%
- 50%
- 20% Correct Answer: 20%