Quiz 1 (Qualifier Stage)
Week 1
Questions 1, 2 & 3
Topic: Sampling and Statistical Inference
An education minister wants to know the status of campus placements of B.Tech students in different engineering institutes of India. An analyst surveyed four randomly selected IITs to analyze the status.
Question 1: Identify the sample and population.
- The sample consists of all the engineering institutes of India and the population consists of randomly selected four IITs of India.
- The sample consists of all the IITs of India and the population consists of all the engineering institutes of India.
- The sample consists of all IITs of India and the population consists of randomly selected four IITs of India.
- The sample consists of four randomly selected IITs of India and the population consists of all the engineering institutes of India.
Answer: Option 4.
- The sample consists of four randomly selected IITs of India and the population consists of all the engineering institutes of India.
Question 2: The analyst’s report states, “The campus placement of B.Tech students is 95% in different engineering institutes of India”. This statement is based on which kind of statistical analysis?
- Descriptive Statistics
- Inferential Statistics
Answer: Option 2.
- Inferential Statistics
Question 3: Is the conclusion made by the analyst on the basis of the chosen sample reliable?
- Yes
- No
Answer: Option 2.
- No
Questions 4, 5, 6, 7 & 8
Topic: Variables, Data Types, and Scales of Measurement
The data of five different types of fertilizers used by farmers of a village is tabulated in Table 1.1.G.
Table 1.1.G
| Fertilizers | Types of Fertilizers | Area of fields (In acres) | Types of Crops | Amount of fertilizers (In Kg) |
|---|---|---|---|---|
| Nitrogen | Inorganic | 1 | Rice | 200 |
| Phosphorus | Inorganic | 2 | Wheat | 400 |
| Manure | Organic | 1.5 | Potato | 300 |
| Compost | Organic | 1.3 | Rice | 260 |
| Potassium | Inorganic | 1.6 | Pulse | 320 |
Question 4: Which of the following statements is/are true?
- Inorganic is a case and Types of Fertilizers is a variable.
- Rice is a case.
- Manure is a case.
- Amount of fertilizers is a variable.
- Nitrogen is a variable.
Answer:
- Manure is a case.
- Amount of fertilizers is a variable.
Question 5: What is the scale of measurement of “Types of Crops”?
- Ordinal Scale
- Nominal Scale
- Interval Scale
- Ratio Scale
Answer: Option 2.
- Nominal Scale
Question 6: What kind of variable is “Area of fields”? (More than one option can be correct)
- Categorical
- Numerical
- Discrete
- Continuous
Answer: Options 2 and 4.
- Numerical
- Continuous
Question 7: What is the scale of measurement of “Amount of Fertilizers”?
- Ordinal Scale
- Nominal Scale
- Interval Scale
- Ratio Scale
Answer: Option 4.
- Ratio Scale
Question 8: Is the data given in Table 1.1.G structured or unstructured?
- The data is structured
- The data is unstructured
Answer: Option 1.
- The data is structured
Question 9
Topic: Types of Data (Cross-sectional vs. Time Series)
The data of Netflix subscribers at the end of the year 2020 across different Asian countries is recorded. Based on this, choose the correct option:
- It is time series data
- It is cross-sectional data
Answer: Option 2.
- It is cross-sectional data
Question 10
Topic: Variable Types and Scales of Measurement
Choose the correct statement(s):
- Stock price of a company is a numeric and continuous variable.
- Number of assignments submitted by a student has an interval scale of measurement.
- Soccer positions (i.e. Defender, Midfielder, Forward) have an ordinal scale of measurement.
- The education level of a person has an ordinal scale of measurement.
Answer: Options 1 and 4.
- Stock price of a company is numeric and continuous variable.
- The education level of a person has an ordinal scale of measurement.
Question 11
Topic: Derived Variables and Measurement Scales
A researcher defines a new metric, “Influence Score”, calculated as:
Influence Score = Number of reshares × Average reach per reshare
Which statement most accurately describes the “Influence Score” variable?
- It is a categorical variable because it is based on behavioral data.
- It is a continuous variable that is measured on an interval scale.
- It is a quantitative variable derived from other data and measured on a ratio scale.
- It is an ordinal variable, as it ranks users according to their influence.
Answer: Option 3.
- It is a quantitative variable derived from other data and measured on a ratio scale.
Week 2
Question 1
Topic: Descriptive Statistics (Definitions & Representations)
Which of the following statements is/are incorrect?
- To represent the share of a particular category, a bar chart is the most appropriate graphical representation.
- The multiplication of the total number of observations and the relative frequency of a particular observation should be equal to the frequency of that observation.
- The mean can be defined for a categorical variable.
- The mode of a categorical variable is the widest slice in a pie chart.
Answer: Options 1 and 3.
- To represent the share of a particular category, bar chart is the most appropriate graphical representation.
- Mean can be defined for a categorical variable.
(Note: Pie charts are typically better for showing shares of a whole, and mean is not defined for categorical data.)
Questions 2 & 3
Topic: Data Visualization (Pie Charts)
Figure 2.1.G shows the pie chart representation of the weightage distribution of 5 different subjects in an exam.

Question 2: If the exam is for a total of 500 marks, what is the aggregate distribution of marks in Physics, Maths, and Biology?
Answer:
315(Calculation: (35% + 18% + 10%) of 500 = 63% of 500 = 315)
Question 3: Choose the correct statement(s):
- The pie chart is misleading because it does not obey the area principle.
- The pie chart has round-off errors.
- The pie chart is not a misleading graph.
- The slices of the pie chart add up to 100%.
Answer: Options 3 and 4.
- The pie chart is not a misleading graph.
- The slices of pie chart adds up to 100%.
Questions 4, 5, 6 & 7
Topic: Descriptive Statistics (Frequency, Median, Mode) & Data Visualization
Table 2.1.G represents the distribution of 200 cricket players trained by different cricket academies in Chennai. Each academy has trained at least one player.
| Academy | Number of Players |
|---|---|
| A | a |
| B | b |
| C | 50 |
| D | d |
| E | 75 |
Question 4: What is the combined relative frequency of academies A, B, and D?
Answer:
0.375(Calculation: Total players = 200. Players in C & E = 50 + 75 = 125. Players in A, B, D = 200 - 125 = 75. Relative frequency = 75/200 = 0.375)
Question 5: The median of the given data is:
- Academy C
- Academy E
- Academy D
- Median is not defined for the given data
- Insufficient data
Answer: Option 4.
- Median is not defined for the given data (because the data is nominal/categorical).
Question 6: The mode of the given data is:
- Academy C
- Academy E
- Academy D
- Mode is not defined for the given data
- Insufficient data
Answer: Option 2.
- Academy E (it has the highest frequency of 75 players).
Question 7: Which graphical representation is appropriate for the data in Table 2.1.G?
- Bar chart
- Pie chart
- Pareto chart
- Both bar chart and pareto chart
Answer: Option 4.
- Both bar chart and pareto chart.
Question 8
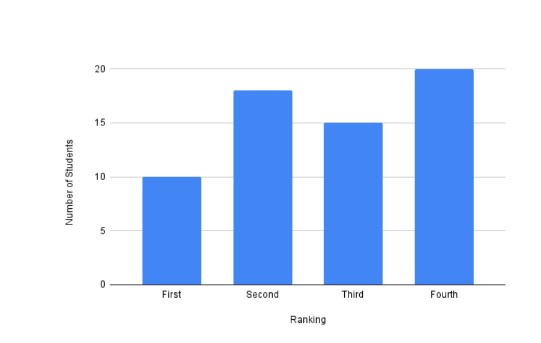
Topic: Data Visualization (Bar Charts)
The data of the number of students sharing the same rank is collected. Which of the following is/are suitable to represent the collected data?
- Image 1 (Vertical Bar Chart)
- Image 2 (Horizontal Bar Chart)
- Image 3 (Another Chart)
Answer: Option 2 (The second image).
Question 9
Topic: Data Types (Categorical Data)
Choose the correct statement about categorical data:
- Categorical data have measurement units.
- Categorical data can take numerical values, but no meaningful mathematical operations can be performed on it.
- Categorical data is quantitative in nature.
- All of the above.
Answer: Option 2.
- Categorical data can take numerical values, but no meaningful mathematical operations can be performed on it.
Questions 10 & 11
Topic: Data Visualization (Pie Charts)
The distribution of grades in a Statistics class of 80 students is shown by a pie chart in Figure 2.2.G.

Question 10: How many students secured a B grade?
Answer:
26(Calculation: 32.5% of 80 = 26)
Question 11: What is the ratio of the students who secured a C grade to the students who secured an A grade?
Answer:
0.9(Calculation: 22.5% / 25.0% = 0.9)
Questions 12 & 13
Topic: Data Visualization & Interpretation (Pie Charts)
The figure represents the placement percentage of students in different sectors from an engineering college.

Question 12: What is the mode of the placement sectors?
- Software
- Analytics
- Core
- Mode is not defined
Answer: Option 1.
- Software (it has the highest percentage, 35%)
Question 13: If 1000 students were placed, which of the following statements is true?
- The difference between students in Core and the sum of those in Consultancy and Analytics is 100.
- The mode is shared by Analytics and Software.
- The sector with the second-highest placement has 50 more students placed than the lowest sector.
- The sector with the least placement has half as many students as the highest placed sector.
Answer: Option 3.
- The sector with the second-highest placement has 50 more students placed than the lowest sector. (Calculation: 2nd highest is Core (25% = 250 students). Lowest is Consultancy (20% = 200 students). Difference is 250 - 200 = 50.)
Question 14
Topic: Data Analysis (Percentages in Tables)
An engineering college recorded student placements over four years as shown in the table. In which year did the Software domain constitute the highest percentage of the total placements for that year?
| Year | Analytics | Software | Business Development |
|---|---|---|---|
| 2021 | 20 | 40 | 10 |
| 2022 | 25 | 35 | 15 |
| 2023 | 30 | 45 | 5 |
| 2024 | 35 | 50 | 10 |
- 2021
- 2022
- 2023
- 2024
Answer: Option 1.
- 2021 (with ~57.1%)
Week 3
Question 1
Topic: Measures of Central Tendency (Mean of a Frequency Distribution)
The numbers 2, 6, 11, and 14 have frequencies , , , and respectively. If their mean is 5.63, find the value of . (Enter the value as the next highest integer).
Answer:
4
Questions 2 & 3
Topic: Correcting Mean and Variance
The mean and sample standard deviation of a dataset of 6 observations are 19 and 9, respectively. Later, it is found that one observation, 11, was wrongly recorded as 7.
Question 2: What is the correct mean of the original dataset? (Correct to 2 decimal places)
Answer:
19.67
Question 3: What is the correct sample variance of the original dataset? (Correct to 2 decimal places)
Answer:
64.47
Question 4
Topic: Measures of Dispersion (Properties of Variance)
Let the data 75, 25, 29, 75, 83, 24 represent the retail prices of a commodity. What will be the sample variance of the prices if 4 rupees is added to all the prices? (Correct to 2 decimal places)
Answer:
812.17
Question 5
Topic: Measures of Position (Percentiles)
Given the 6 observations: 37, 30, 28, 37, 82, 112. Calculate the 10th, 50th, and 100th percentiles.
- 28, 38.0, 112
- 29, 38.0, 112
- 28, 37.0, 112
- 28, 36.0, 112
Answer: Option 3.
- 28, 37.0, 112
Questions 6 & 7
Topic: Measures of Dispersion (IQR) and Outliers
Given the 10 observations: 39, 46, 44, 30, 73, 96, 91, 115, 112, 89.
Question 6: Calculate the Interquartile Range (IQR) of the data.
- 52
- 97
- 96
- 53
Answer: Option 1.
- 52
Question 7: How many outliers are there in the data?
- 3
- 0
- 1
- 2
Answer: Option 2.
- 0
Question 8
Topic: Measures of Central Tendency (Mean and Mode of a Frequency Distribution)
In a deck, there are cards numbered 1 to 21. The number of cards for any particular number is the same as that number (e.g., there are 21 cards with the number 21). Which of the following statements is/are true about the mean and mode of the numbers on the cards in this deck?
- Mean is 11.0.
- Mode is 21.
- Mean is 14.33.
- Mode is not defined for this data.
- Mode is 20.
- Mean is 21.
Answer: Options 2 and 3.
- Mode is 21.
- Mean is 14.33.
Questions 9 & 10
Topic: Data Interpretation (Stem-and-Leaf Plots, IQR, Median)
The following stem-and-leaf plot shows an actor’s performance ratings (out of 100). (Note: 6 | 8 means a rating of 68).
| Stem | Leaf |
|---|---|
| 4 | 4 |
| 5 | 2 3 6 |
| 6 | 8 |
| 7 | 8 |
| 8 | 0 1 3 9 9 |
| 9 | 0 |
Question 9: What is the Interquartile Range (IQR)? (Correct to 1 decimal place)
Answer:
35.7to36.3
Question 10: What is the new median rating if 2 points are added to all ratings and the total is then converted to a 30-point scale? (Correct to 2 decimal places)
Answer:
24.30
Questions 11 & 12
Topic: Data Analysis & Correction
A factory records its daily production over 10 days: x, x + 15, 140, 150, 160, 170, 180, 190, 15, 20.
Question 11: If the average daily production over these 10 days is 128 units, what is the value of x?
Answer:
120
Question 12: It was later discovered that:
- For days 5 to 7 (160, 170, 180), the recorded numbers were 15 units higher than the actual production.
- On days 9 and 10, the numbers were mistakenly recorded with the last digit missing (15 was actually 150, and 20 was actually 200). Calculate the correct average daily production after these adjustments.
Answer:
155
Question 13
Topic: Measures of Central Tendency (Weighted Average)
A teacher conducted a test (out of 50) for two sections of a class.
- Section A has 15 students with an average score of 32.
- Section B has 25 students with an average score of
x. If the combined average score of all 40 students is 34, find the value ofx. (Correct to one decimal place)
Answer:
35.2
Week 4
Questions 1-7
Topic: Bivariate Data Analysis (Covariance & Correlation)
The table represents sales data (in Lakhs) for OnePlus and BBK Electronics from 7 dealers in Chennai and Punjab in 2010.
| Dealer’s Location | OnePlus | BBK Electronics |
|---|---|---|
| Chennai | 6 | 10 |
| Punjab | 2 | 10 |
| Chennai | 1 | 11 |
| Punjab | 1 | 11 |
| Chennai | 2 | 10 |
| Punjab | 1 | 11 |
| Chennai | 6 | 16 |
Question 1: Are you able to see the 7 dealer’s locations and sales data? (This is a check question from the platform).
Answer: Yes
Question 2: What is the population standard deviation of OnePlus sales? (Correct to 2 decimal places)
Answer:
2.12
Question 3: What is the sample standard deviation of BBK Electronics sales? (Correct to 2 decimal places)
Answer:
2.14
Question 4: What is the sample co-variance between the sales of OnePlus and BBK Electronics? (Correct to 2 decimal places)
Answer:
2.43
Question 5: What is the correlation coefficient between the sales of OnePlus and BBK Electronics? (Correct to 2 decimal places)
Answer:
0.49
Question 6: What can you say about the linear relationship between the sales of OnePlus and BBK Electronics? (More than one option can be correct)
- Weak
- Positive
- Moderate
- Negative
- Strong
- Absence of linear relationship
Answer: Options 2 and 3.
- Positive
- Moderate
Question 7: Is the sales of OnePlus strongly influenced by the location of the dealer?
- No
- Yes
Answer: Option 1.
- No
Questions 8-13
Topic: Contingency Tables & Proportions
725 college students are classified according to their intelligence level and economic conditions.
| Economic Conditions | Bright | Average | Dull | Borderline |
|---|---|---|---|---|
| Good | 59 | 85 | 84 | 149 |
| Poor | 68 | 93 | 83 | 104 |
Question 8: Are you able to see all eight values in the contingency table? (This is a check question from the platform).
Answer:
1(for Yes)
Question 9: What proportion of total students are dull? (Correct to 2 decimal places)
Answer:
0.23
Question 10: What proportion of total students are in poor economic conditions? (Correct to 2 decimal places)
Answer:
0.48
Question 11: What proportion of students in good economic conditions are borderline? (Correct to 2 decimal places)
Answer:
0.40
Question 12: What percentage of bright students are in poor economic conditions? (Correct to 2 decimal places)
Answer:
53.54
Question 13: What percentage of average students are in good economic conditions? (Correct to 2 decimal places)
Answer:
47.75
Question 14
Topic: Properties of Correlation Coefficient
Let A and B be the monthly sales of two salespersons, Anjali and Bharat. In each of six months, Bharat’s sales were exactly 1000 rupees more than twice Anjali’s sales (i.e., B = 2A + 1000). Which statement about the correlation coefficient is necessarily true?
- The correlation coefficient between A and B is equal to 0.
- The correlation coefficient is greater than 0 but less than 1.
- The correlation coefficient between A and B is equal to 1.
- The correlation coefficient cannot be determined.
Answer: Option 3.
- The correlation coefficient between A and B is equal to 1.
Question 15
Topic: Correlation and Scatter Plots
An analyst recorded the daily screen time (X, in minutes) and sleep duration (Y, in hours) for 6 individuals.
| Individual | Screen Time (X) | Sleep Duration (Y) |
|---|---|---|
| 1 | 40 | 9 |
| 2 | 45 | 8 |
| 3 | 90 | 5 |
| 4 | 55 | 6 |
| 5 | 60 | 7 |
| 6 | 70 | 4 |
Based on the data, which of the following statements is/are true?
- There is a negative correlation between the daily screen time and sleep duration.
- The correlation coefficient between the daily screen time and sleep duration is exactly -1.
- The scatter plot of the data would display a negative trend.
- The population covariance between the daily screen time and sleep duration is -28.
Answer: Options 1 and 3.
- There is a negative correlation between the daily screen time and sleep duration.
- The scatter plot of the data would display a negative trend.